Super-emitters and persistent source regions.
The Bucharest landfills were SMART-CH4's stress test: can independent satellite systems agree on what a single facility emits?
Bucharest: a landfill and its paperwork
The Vidra landfill (44.314°N, 26.127°E) — referred to as “Sintești” in some project documents, after the neighbouring village; same landfill — is SMART-CH4's single most legible result.
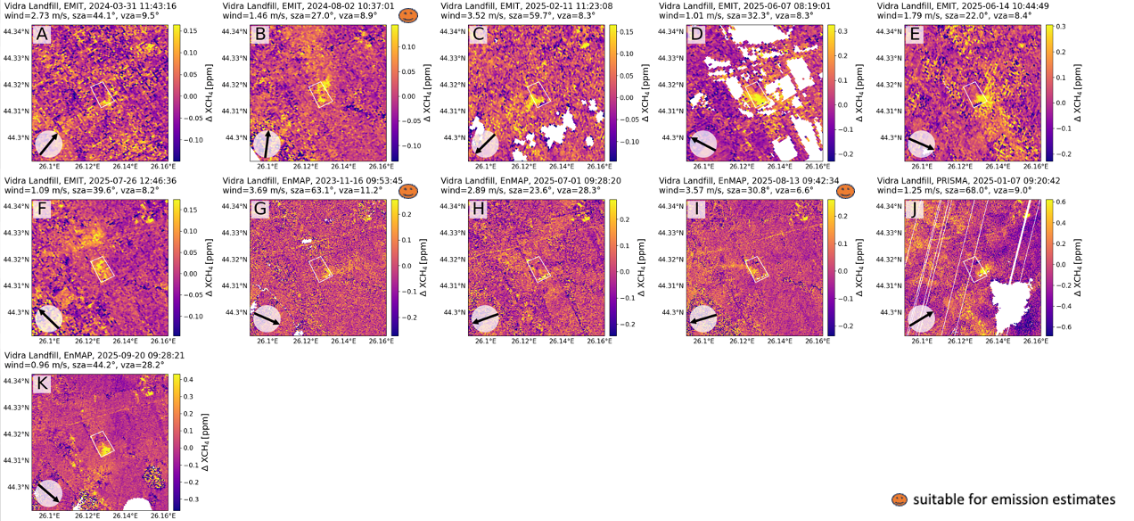
Hyperspectral imagery was processed with the HiFi retrieval package — three independent methods (Physics-Forward, Principal Component Analysis, Matched Filter) — followed by a cross-sectional flux quantification. Of 22 archived overpasses (9 EnMAP, 13 EMIT, 3 PRISMA), cloud cover left a usable subset in which 11 plumes were detected, yielding three emission estimates for Vidra.
| Source | Estimate |
|---|---|
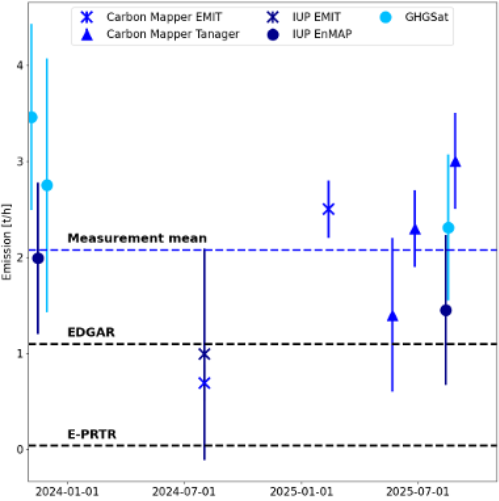
| EnMAP, EMIT, PRISMA (this study) | 1–3 t/h |
| GHGSat | broadly consistent |
| Carbon Mapper (EMIT and Tanager) | broadly consistent |
| E-PRTR official report | ~0.05 t/h (≈470 t/yr) |
Independent instruments, independent teams, independent retrieval methods — converging on roughly one to three tonnes per hour. The facility's official filing to the European Pollutant Release and Transfer Register is around forty times lower. The satellite estimates agree far better with EDGAR (which uses pre-2018 E-PRTR figures) than with what the facility reports today.
Alongside this, SRON's machine-learning pipeline found 15 TROPOMI plumes near Bucharest between October 2018 and September 2024, and identified two persistent long-term hotspots in the area — landfills being the most likely cause of both. The neighbouring Glina landfill showed no detectable plume in any available scene. Cloud cover was the limiting factor throughout: this is a result won from a small number of clear-sky opportunities.
MethaneSAT ceased operations in June 2025 after contact was lost; its archive of ~1,400 acquisitions from May 2024–June 2025 remains open to registered scientific users. Around 15 collections cover Romania, mostly cloud-contaminated; emissions from the Bucharest landfills are visible in one target.
217 persistent methane source regions (IUP Bremen) [TN2 §3.1.1]
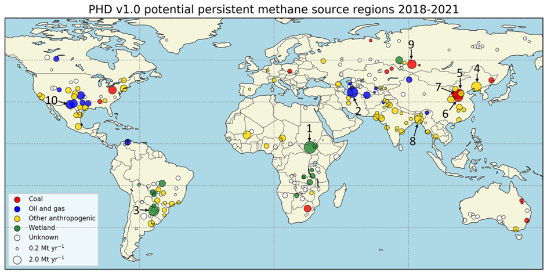
An automated algorithm applied to four years of TROPOMI/WFMD data (2018–2021) identified 217 “potential persistent source regions” worldwide — places where methane is reliably elevated, not just occasionally. Classified against EDGAR v6.0, GFEI v2.0 and WetCHARTs v1.3.1:
| Dominant source | Share of PPSRs |
|---|---|
| Other anthropogenic (landfills, agriculture) | 30.4% |
| Coal | 7.8% |
| Oil and gas | 7.8% |
| Wetlands | 7.3% |
| Unknown | 46.5% |
Nearly half could not be attributed to any known source at all. That is itself a finding.
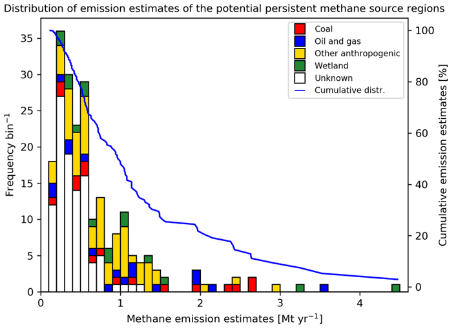
And the wetlands are enormous. The largest PPSR on Earth is the Sudd wetland in South Sudan:
| Source | Estimate for the Sudd |
|---|---|
| This study (TROPOMI) | 4.5 ± 0.9 Mt/yr |
| WetCHARTs v1.3.1 | 0.88 Mt/yr |
| EDGAR v6.0 | 0.17 Mt/yr |
| GFEI v2.0 | 0.01 Mt/yr |
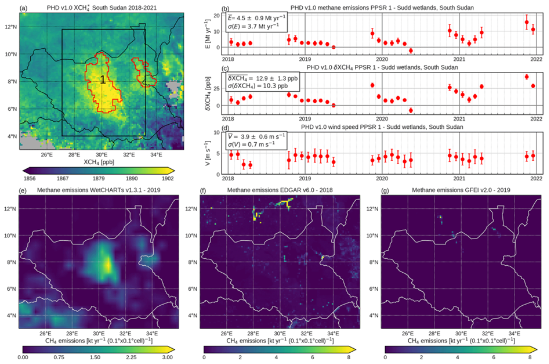
Even accounting for non-wetland emissions the satellite estimate likely also picks up in this region, the hotspot analysis is roughly five times what state-of-the-art emission datasets predict for the Sudd. Combined with a neighbouring region, the total (5.3 ± 1.3 Mt/yr) agrees with independent published estimates. The Iberá wetland in Argentina — the third-largest PPSR — tells the same story: 3.3 ± 1.1 Mt/yr observed against 0.64 Mt/yr in WetCHARTs, again roughly five times. Across every wetland-dominated PPSR, the satellite estimate exceeds the inventory, usually by a large factor.
Published as Vanselow et al., ACP, 24, 10441, 2024 (doi:10.5194/acp-24-10441-2024).
Machine learning for plume quantification (SRON) [TN2 §3.1.2, FR]
SRON detects methane plumes in TROPOMI daily — 2,297 large plumes in 2023 alone, categorised by likely source. Quantifying them has relied on the Integrated Mass Enhancement (IME) method, which carries a known wind-speed-dependent bias.
ML-SPERE, a convolutional network trained on simulated TROPOMI plumes (with wind, surface pressure, pixel size and a plume mask as extra channels), outperforms IME on held-out synthetic plumes and removes the wind-speed bias — particularly below 2 m/s, which matters because the detection pipeline over-represents low-wind scenes (they are easier to see). Applied to a well-studied blowout in Kazakhstan, it agrees better with inverse modelling and high-resolution satellites than TROPOMI IME does. Applied to all 2021 detections, sectoral averages are largely unchanged — the correction is in the individual estimates, not the totals. Paper submitted to AMT.
Plume detection datasets for 2021 and 2023 have been released. (The two years use different pipelines and should not be compared for trends.)
Read more:
- Vanselow et al., ACP, 2024 — Publications
- Roberts et al., ML-based emission rate estimates of global super-emitters, AMT, submitted — Publications
- TROPOMI plume detections (2021, 2023) and Bucharest hyperspectral plume detections — Data