δ13C-CH4: source signatures from space.
Every methane source carries an isotopic fingerprint: biogenic sources (wetlands, cattle, landfills) are isotopically light, fossil sources heavier, fires heavier still. If you know the fingerprints, the atmosphere tells you the mixture.
A new global source-signature dataset [TN2 §3.3.2]
SMART-CH4 produced a gridded, sector-resolved global dataset of δ13C-CH4 source signatures for 1998–2022, built from a literature review plus recent sector-specific datasets, with time extrapolation where signatures are known to have drifted (US oil and gas, wetlands) and aggregation weighted by CH4 emission per grid cell.
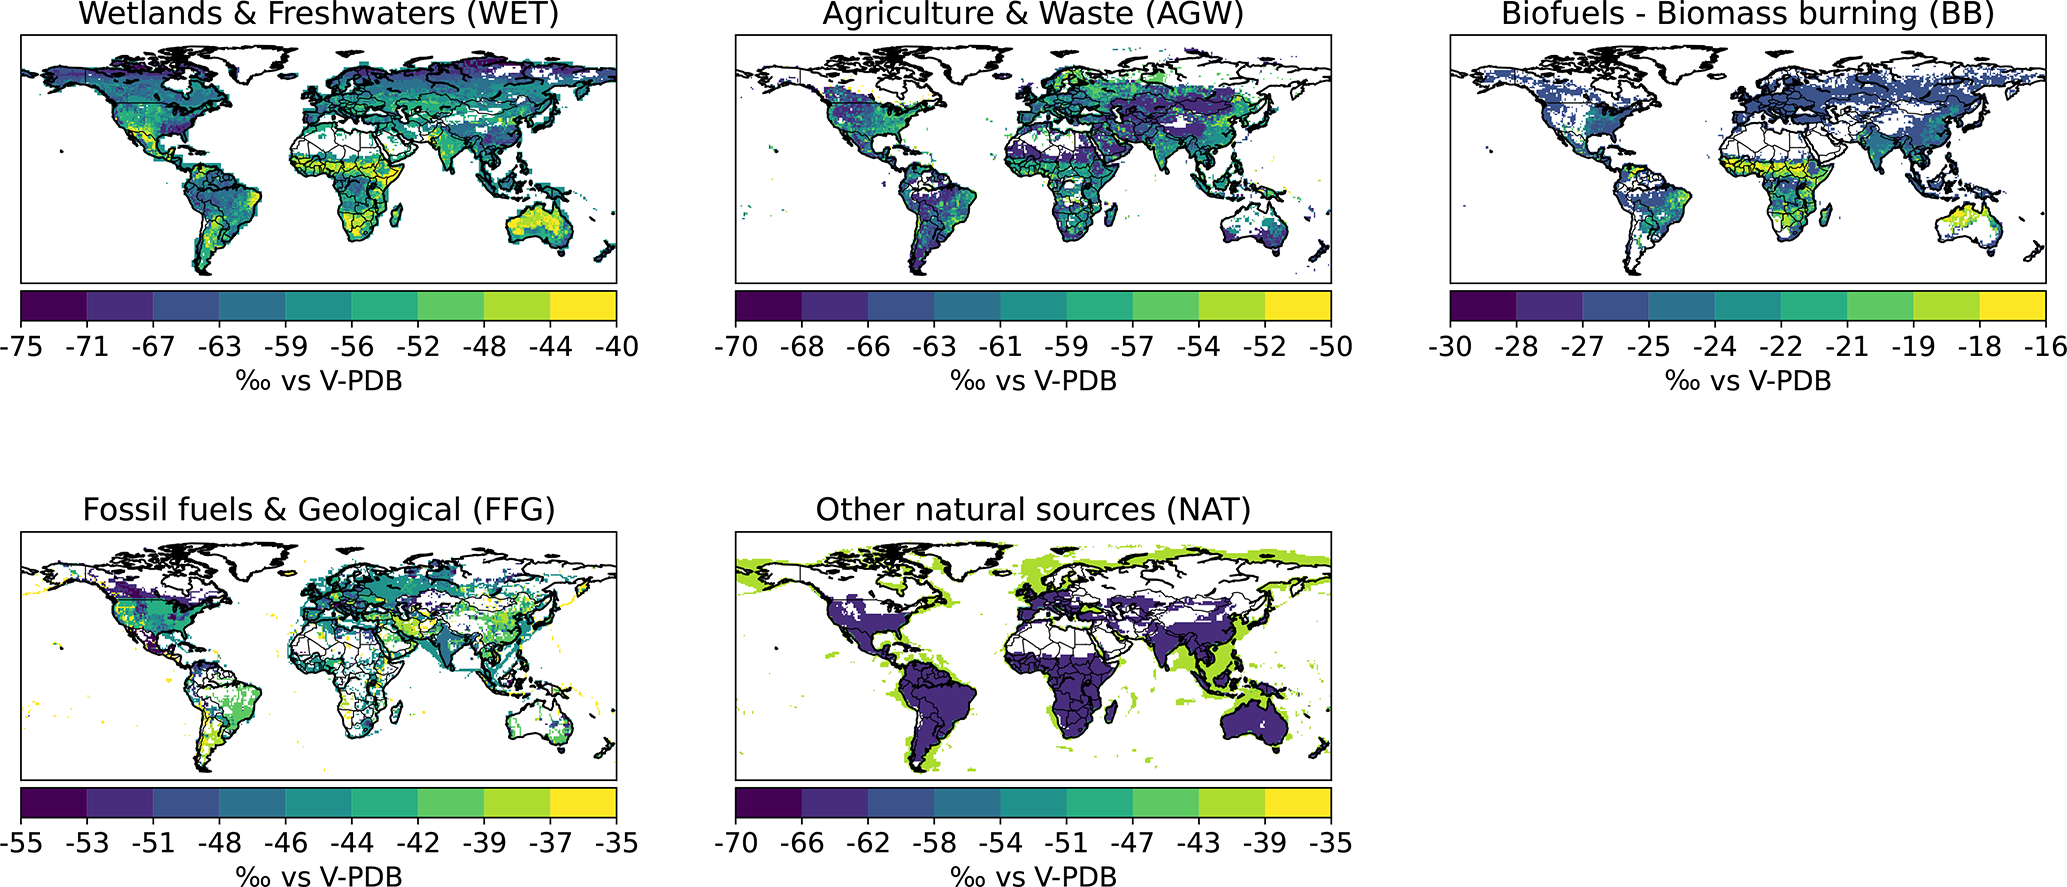
DOI: 10.57780/esa-6d202e9 · Tapin et al., ESSD, 2026. doi:10.5194/essd-18-4793-2026
Can we see it from space?
A Monte-Carlo signal-to-noise study (CIF–LMDz–SACS, synthetic GOSAT, TROPOMI and IASI observations, 2018–2024, 15 ensemble members) gives a clear and slightly deflating answer:
- Pixel-scale detection is not feasible with any current instrument.
- Detectability emerges only through aggregation — spatial (regional → hemispheric → global) and temporal (monthly → seasonal cycle → trend).
- At those scales, systematic error becomes the limiting factor, not noise. An unresolved 5‰ systematic bias cancels partially in temporal differencing and fully in inter-hemispheric gradients, but not at all in absolute totals.
So δ13C-CH4 from space may support source attribution — but only in specific large-scale configurations, and only once systematic errors are controlled. (Which loops back to the spectroscopy work: that is precisely the constraint being attacked.)
What isotopes do to an inversion
A sensitivity analysis identified the kinetic isotope effect as the dominant source of spread — an ensemble approach is recommended — while the choice of aggregation method barely matters, meaning the new maps can be used directly. δ13C uncertainties must be propagated through the inversion, and agriculture/waste signatures should be optimised rather than fixed.
Preliminary joint CH4 + δ13C-CH4 inversions (surface network, 2002–2020) shift posterior wetland fluxes by 17 Tg/yr relative to a CH4-only inversion — a large change in one of the most uncertain terms in the global budget. Six inversions across three OH fields show where isotopes would help most: agriculture/waste and wetlands have the largest inter-inversion spread, and fossil-fuel disagreement concentrates over major producing regions. Satellite-based isotopic inversions have not yet converged; that work continues.
Read more:
- Tapin et al., paper · dataset DOI 10.57780/esa-6d202e9 — Data · Publications
- Spectroscopy — the TIR work behind isotope detectability