Better methane data from TROPOMI.
Four changes developed in SMART-CH4 are now in the operational Sentinel-5P methane product. A parallel scientific product, TROPOMI/WFMD, was rebuilt from the ground up — and a merged multi-sensor record now spans 2003–2024.
Operational TROPOMI CH4 (SRON)
De-striping from v02.07.01 · [TN1 §3.2]
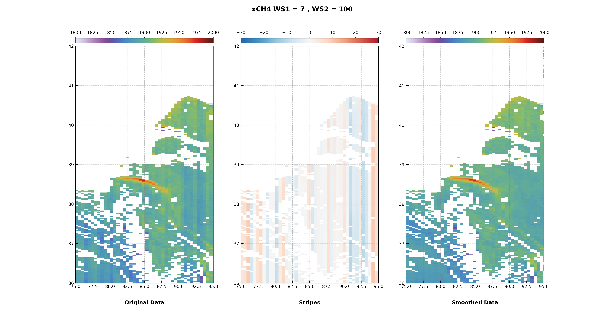
TROPOMI SWIR data carry an artificial striping pattern along the flight direction, up to a few percent in intensity — enough to interfere with detecting small point sources and reading plume shapes. A double-median smoothing correction (a 7-pixel window across-track, then a 100-pixel window along-track) removes it. Validated against TCCON: the bias is unchanged, the scatter slightly improves, and — critically — plume structure is preserved.
Machine-learning cloud clearing from v02.08.00 · [TN1 §3.2]
TROPOMI methane has always been cloud-cleared using the VIIRS instrument on Suomi-NPP, which flies in close formation with Sentinel-5P. Suomi-NPP is being decommissioned, and its successor NOAA-20 passes 20 minutes later — too long a gap for reliable cloud matching. A Random Forest classifier trained on 20,000 co-located TROPOMI/VIIRS orbits over five years now reproduces VIIRS-like cloud clearing from TROPOMI data alone. Validated at 12 TCCON stations over 2018–2022, it agrees with VIIRS filtering in both bias and scatter. A C++ implementation (Balsa libraries) makes it fast enough for operations, and it enabled the near-real-time CH4 release (from v02.09.01). A proposed relaxed pre-filter threshold is expected to increase global coverage by roughly 50%.
A learned quality flag v02.09.01, released November 2025 · [TN1 §3.2]
The old qa_value came from hard-coded threshold rules. The new flag is trained on
the actual bias between TROPOMI and TCCON, using retrieval features (viewing geometry, albedo,
aerosol parameters, retrieval diagnostics), and assigns each sounding a quality label from 0
(strictest) to 3. Users filter cumulatively — 0 for maximum precision,
0+1 for a balance, 0–3 for full coverage — choosing their
own trade-off instead of inheriting someone else's. Available as
PRODUCT/SUPPORT_DATA/DETAILED_RESULTS/quality_flag_experimental, with ATBD and PUM
on Zenodo (10.5281/zenodo.14186320,
10.5281/zenodo.14186406). A
land_fraction key was added alongside it.
TROPOMI/WFMD v2.0 (IUP Bremen) [TN1 §3.1]
A new version of the scientific WFMD product, replacing the Random Forest quality filter with XGBoost and improving the training data (TROPOMI Aerosol Index, updated VIIRS cloud product — used in training only, so the product stays independent of them at inference time).
Validated against 26 TCCON sites (GGG2020) for May 2018 – June 2024:
| Metric | Value | Meaning |
|---|---|---|
| Random error | 13.3 ppb | single-measurement precision |
| Systematic error | 4.4 ppb | station-to-station accuracy — comparable to TCCON's own ~3.5 ppb |
| Global offset | 0.7 ppb | essentially zero |
| Uncertainty ratio | 1.03 | reported uncertainties are realistic |
And the coverage gains that matter for inversions: ~10% more collocations on average, over 40% more in the Arctic than v1.8, with the global offset against TCCON now close to zero and daily means correlating with TCCON at R = 0.96. Individual overpasses show +20% to +61% more cloud-free data over Central Europe and Siberia.
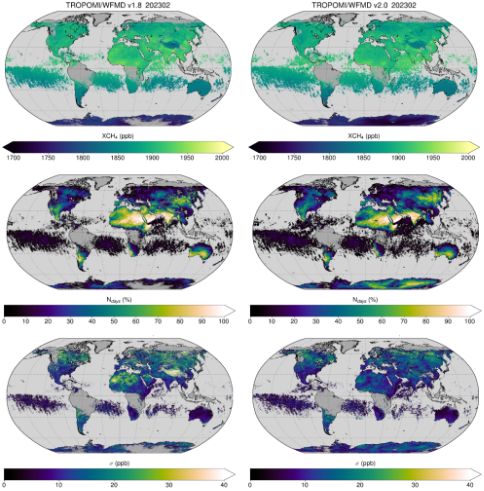
The product also filters better where it should. During a Saharan dust storm from the Bodélé Depression in March 2023, v2.0 removed 19% more data than v1.8 — the high, aerosol-correlated values that had biased the older version. Two independent tests (hierarchical Bayesian regression against TCCON; a dynamic-linear-model analysis over the Sahara) find no significant surface-albedo bias: slopes of −1.0 ± 1.5 ppb and 4.4 ± 6.5 ppb, both statistically indistinguishable from zero.
Algorithm paper accepted in AMT (10.5194/egusphere-2025-5422). Data at IUP Bremen — see Data.
EMMA v5.1 — the merged multi-sensor record (IUP Bremen) [TN1 §3.1.2]
EMMA merges methane retrievals from several sensors into one long, consistent record. Earlier versions selected, for each 10°×10° monthly cell, whichever product sat at the ensemble median — which meant coverage could change abruptly from cell to cell, and TROPOMI was excluded entirely because of its data volume.
v5.1 inverts the logic: a reference product is chosen per period, and the ensemble median is used to correct it. The merged L2 product therefore keeps the reference product's spatial resolution and sampling — making it usable for hotspot analysis, not just trends. TROPOMI/WFMD v2.0 is now included, and the gridded L3 product moves from monthly 5°×5° to monthly 1°×1°. The result is a consistent global methane record spanning 2003–2024, long enough to assess interannual variability and trends. Validated against TCCON and verified for consistency against the previous v4.6.
Read more:
- Borsdorff et al., Random Forest Classifier for cloud clearing of the operational TROPOMI XCH4 product. Remote Sensing, 16(7), 1208, 2024. — Publications
- Schneising et al., TROPOMI/WFMD v2.0. AMT, accepted. — Publications
- Datasets: TROPOMI/WFMD v2.0, EMMA v5.1, operational TROPOMI CH4 ATBD/PUM — Data